
From Fjord to Space: Remote Sensing Meets Whale Watching
- Elding's research team

- Aug 25, 2025
- 5 min read
Updated: Aug 26, 2025
From beginning to mid of July 2025, Victor, a PhD student from Germany, frequently joined our whale watching tours in Eyjafjörður (Akureyri) to collect data for his doctoral research. Victor is working in the research group “Earth Observation and Modelling” (EOM) of Natascha Oppelt at Kiel University in Germany (https://www.eom.uni-kiel.de/en). EOM uses remote sensing methods to monitor and model environments at sea, along the coast, and on land. They are using various measuring devices and platforms, like satellites, drones, and ground-based instruments, to measure sunlight reflected from the Earth’s surface. From this, they develop remote sensing-based applications for analyzing terrestrial and aquatic systems. In the end, they are able to produce results, e.g., in form of maps that show how land surfaces are covered and used, how good the water quality of coastal waters and lakes is, or how much blue carbon is approximately stored in coastal ecosystems. Victor has a background in Geography, works mainly in Arctic regions, and is member of the EU-funded ICEBERG project (https://arctic-iceberg.eu/) that investigates Arctic pollution in Svalbard, Greenland, and Iceland. In his doctoral research, he is addressing adjacency effects in optical remote sensing data over high-contrast environments to improve the quality of satellite products. Here you can read about what that actually means, why he does it, and what exactly he measured on our tours.
What are adjacency effects in optical remote sensing?
Optical satellite sensors work quite similar to your phone camera. Both systems capture sunlight that is reflected by a specific object. Your camera mostly uses three broad color bands (red, green, blue), enabling you to see the image in natural colors as you see the world through your eyes. Most of the optical satellite sensors use narrower bands, including near- and shortwave-infrared, which helps to identify different surface types, such as water, vegetation, soil, and snow/ice, more easily.
Because satellites are located hundreds of kilometers from Earth’s surface, sunlight travels a long way through the atmosphere. Along that path, tiny atmospheric particles scatter some light towards the sensor and certain gases absorb light at specific wavelengths. As a result, the signal received by the satellite sensor is a mix of signals from surface and atmosphere, causing a lack of sharpness and shift of colors. The lack of sharpness is further increased by so-called adjacency effects. Adjacency effects occur where bright and dark surfaces are located right next to each other, which is given in contrasted environments such as coastlines, estuaries, fjords, lakes, and sea ice. Light reflected from surrounding bright surfaces is scattered due to the presence of the atmosphere into the sensor’s field of view. Therefore, a dark pixel in the image looks brighter and vice versa. The net effect is blurring of the image, which is why the effect is also known as blurring effect.
The contributions from the atmosphere and surrounding surfaces can be removed by atmospheric and adjacency effect corrections, aiming for the reduction of blurring and estimation of real target surface reflection.
Why does it matter?
Satellites overpass the same place on Earth at recurring times, but the atmosphere and its impact on the signal received by the satellite sensor are never the same for each overpass. Atmospheric correction standardizes images to show reflection of the Earth’s surface, which enables quantitative comparison of satellite images from different dates.
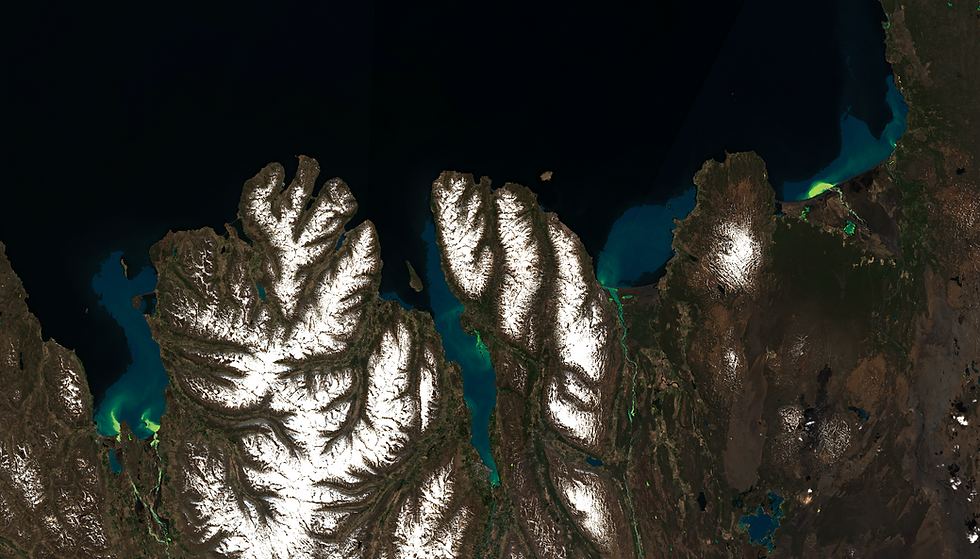
It is also important to correct for adjacency effects, especially when dealing with products over aquatic environments. One example is chlorophyll-a concentration, which is a proxy for phytoplankton, the elementary basis for the rich life in Eyjafjörður and the reason why we are so lucky to observe the amazing whales in this fjord. Since river runoff brings a high amount of nutrients into the sea and “fertilizes” the water, chlorophyll-a concentration and density of phytoplankton are often highest close to the shore (see Figure 1, which shows chlorophyll-a and sediment content around Northeast Iceland in May 2025). For estimating chlorophyll-a over a wider extent, satellite imagery is essential. However, the vicinity of land makes the retrieval with remote sensing tools quite challenging due to the vulnerability for adjacency effects. Therefore, such products currently often lack accuracy, which can be improved by making suitable atmospheric and adjacency effect corrections. Such corrections and accurate remote sensing-based products help to monitor algal blooms, eutrophication, and long-term climate trends affecting ecosystems more accurately and effectively.
What was measured during the tours in Eyjafjörður and why?
The Eyjafjörður forms a difficult place to retrieve accurate satellite data because of its variety in terrain, optically complex water, and atmospheric interferences (e.g., due to the volcanic haze we had mid of July in many parts of Iceland). Additionally, Arctic regions are still underrepresented in scientific research, since most research is focused on mid-latitude regions, leading to the fact that current atmospheric and adjacency effect corrections have difficulties in such environments. This makes the area around Eyjafjörður a really interesting place for advancing this research field.
Victor’s measurements help evaluate the accuracy of satellite images. For this, he installed a setup consisting of three spectroradiometers in front of our boats Hólmasól and Konsull to measure the sun’s downwelling radiation, the upwelling radiation from the seawater, and the diffuse sky radiation (see Figure 2). These measurements allow him to calculate the water reflection, estimate the amount of water constituents in Eyjafjörður, compare these measurements with data retrieved by various satellite sensors, and improve current corrections.
Victor was able to collect data during 14 tours on 11 different days (see Figure 3). Back from his field work, he is currently in the beginning of data processing and analyses. We will keep you updated.


How to access satellite data?
If you would like to visualize satellite data yourself, we suggest using the Copernicus Browser. The great thing about working with satellite data is that most of the data is free of charge. To use all the functions of the browser, you will need to register a free account, but you can also use it anonymously for visualization and basic tools. You can access the browser here. There are also tutorials in video and text format to help you navigating through the browser.
Victor Lion


Comments